
What is Grafana?
Grafana is our centralized solution used to visualize metrics and performance data from across our infrastructure. It provides real-time graphs, and charts allowing for quick diagnostics and health checks of our systems. This also proves useful for checking system usage for nodes running slurm so you can check your job to see if it is using the resources you expect.
How to access/use Grafana
You can access the Grafana interface directly through your web browser. One important thing to note is that this webpage is only visible on UofU or VPN address space. So if you are trying to view this from home, connect to the campus VPN first.
Logging In
To log in, use your SCI user credentials.
- Navigate to the Grafana URL.
- Enter your SCI credentials
Authentication is handled through our centralized auth, so you do not need a separate password for Grafana.

Available Dashboards
Once logged in, on the left-hand side you will see a dashboard button. Click on that and it will take you to view all the available dashboards. You can search for a specific dashboard or filter by tags to find what you need. Here is a summary of the primary dashboards and what they display:
-
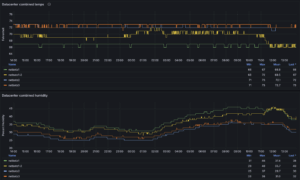
Archive Server System Stats
- Purpose: Monitors the vital signs of the archive server.
- Data Shown: System temperatures, and cache hit rates.
- Tags:
synology,temperature
-
Netbotz Metrics
- Purpose: Displays environmental data from our Netbotz monitoring appliances.
- Data Shown: Focuses on server room and row temperatures. Also shows Humidity and Airflow for rows.
- Tags:
netbotz,temperature
-
System Stats (Node-exporter)
- Purpose: A comprehensive dashboard showing detailed metrics for Linux servers.
- Data Shown: In-depth stats on CPU, memory, disk I/O, network traffic, and other system-level metrics.
- Tags:
linux
-
Nvidia GPU Metrics
- Purpose: Monitors the performance and health of NVIDIA GPUs in our compute servers.
- Data Shown: GPU utilization, memory usage, temperature, and power draw for individual cards. Useful for tracking performance on AI/ML workloads.
- Tags:
nvidia,nvidia-smi,nvidia_gpu_exporter,prometheus
-
Prometheus Stats
- Purpose: A meta-dashboard that shows the health and performance of the Prometheus monitoring service itself.
- Tags:
prometheus
-
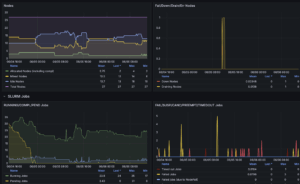
SLURM Dashboard
- Purpose: Provides an overview of our High-Performance Computing (HPC) cluster managed by SLURM.
- Data Shown: Job queue status, node availability, CPU allocation, and specific metrics across the cluster.
- Tags:
Slurm
-
VAST Cluster Statistics
- Purpose: Displays performance and health metrics for our VAST Data storage cluster.
- Data Shown: Cluster capacity, IOPS, latency, and overall system health.
- Tags:
VAST